Project64 Debugger 1 2 3 4 5 ... 7 »
Users browsing this thread: shygoo

Edit | Delete | Reply | Report | Link
Some games that I would like to hack don't run well in Nemu, so I'm making a new debugger for Project64


​Features
• MIPS debugger
    º Built-in assembler functionality for testing code
• Memory read and write breakpoints
    º Support for cart-to-RAM DMA writes
• Symbol management for subroutines and variables
    º Live view of variable values
• Cart-to-RAM DMA logging
    º RAM-ROM address conversion
    º 4-byte ASCII file signature reporting
• Javascript API
    º CPU read/write/execute event hooking
    º Access to virtual memory
        • JS variable and object binding
    º Access to cartridge memory
    º Access to general purpose and floating point registers
    º Basic socket and server support
    º Console logging & input evaluation
• Static RDRAM allocation
    º Memory base is always 0x10000000 for programs like Cheat Engine

​Download

​How to use
To toggle a PC breakpoint, double click an instruction in the command viewer. To add a memory breakpoint, right click bytes in the memory viewer or press the + button next to the breakpoint list in the command viewer. See apidoc.htm for javascript API documentation.

​Video demos

If you have any suggestions or bug reports feel free to post them!
(This post was last modified: December 9th, 2017, 03:15 am by shygoo.)

Edit | Restore | Reply | Report | Link
Embedded javascript api which will be part of the next snapshot


Edit | Delete | Reply | Report | Link
I just wanted to say, having had the same problem wit Nemu, that this is fantastic! Already it's great and your TODO list looks to make it even better.
Thanks for releasing it Smile

Once nice feature would be highlighting uses of the selected instructions registers, so for example, if the selected instruction is LW T9, 0x0000(A0) you can quickly scan up the list to see where A0 is set, and down the list to see where T9 is used.
(This post was last modified: September 26th, 2016, 03:23 am by jaytheham.)

Edit | Delete | Reply | Report | Link
Awesome idea! It will be included in the next release. https://i.gyazo.com/e7f6beac9735b34d764808d1f233f08c.gif

Edit | Delete | Reply | Report | Link
Will it be possible to keep track of the calling stack with this debugging tool?

Edit | Delete | Reply | Report | Link
One thing that might be interesting to see for the purposes of reverse engineering is to be able to define labels for jump and branch instructions, preferrably through some external file. Would be really great is if it also allowed some sort of scripting so that you could define labels for code addressed to virtual spaces. For example, Ocarina of Time's boot animation code is addressed to 80800000, which is then translated to someplace in RAM

Edit | Delete | Reply | Report | Link
Function labeling combined with a callstack would be truly great Big Grin

Edit | Delete | Reply | Report | Link
Thanks so much for this Shygoo! Here's a peak at what I've cooked up with this PJ64 debugger that he's put together:


Edit | Delete | Reply | Report | Link
New snapshot is up - here are some notable new features:
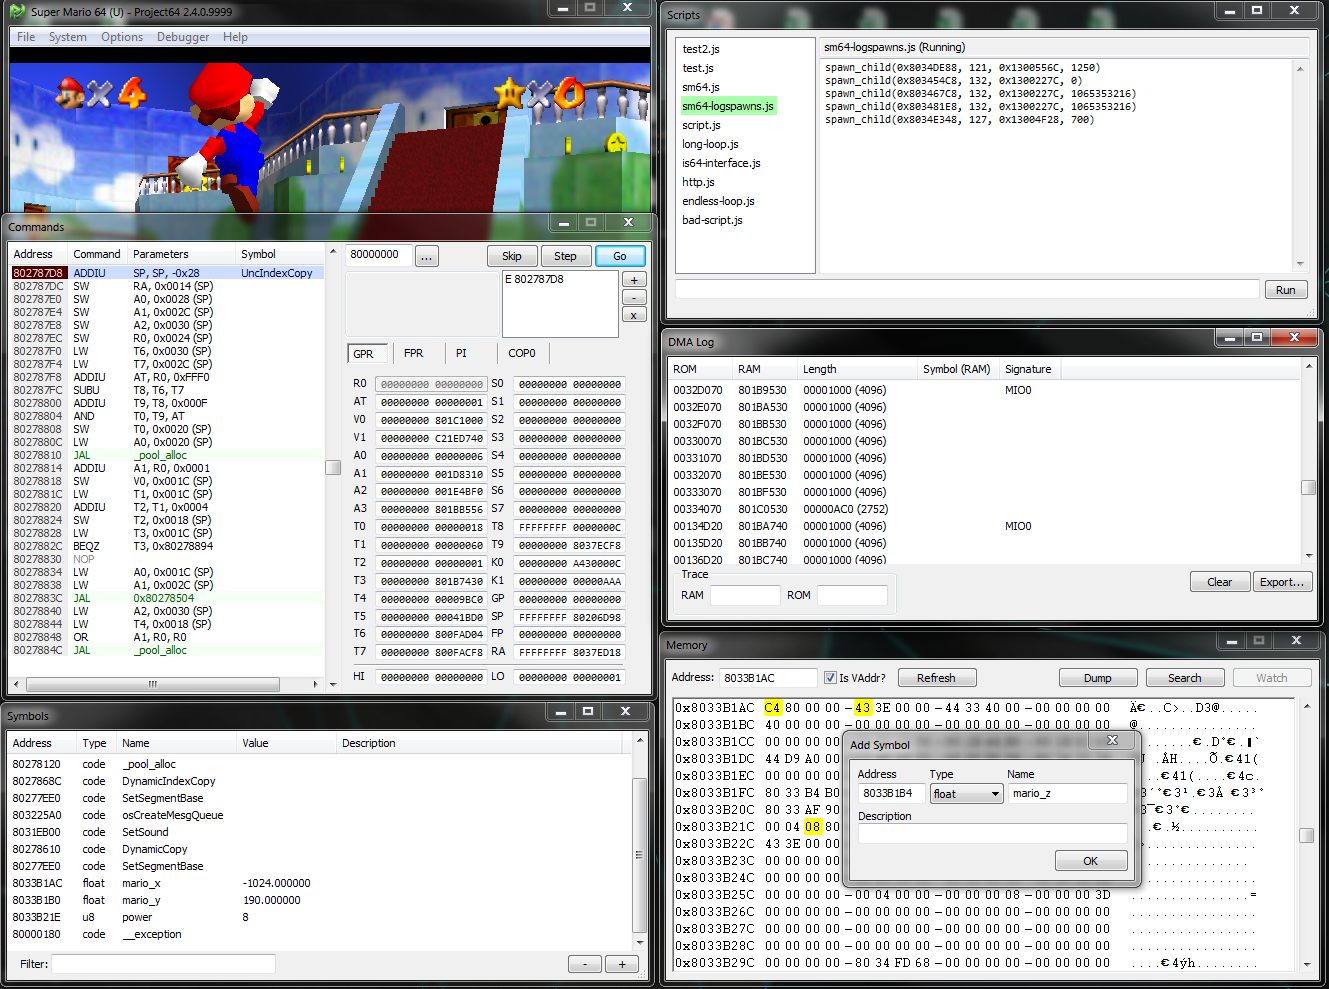
Added javascript api (basic support; just runs whatever is in _api.js & _script.js in a single context on startup)
Made GPR registers in debugger proper 64-bit
Added PI register tab
Memory write breakpoints now catch cart-to-ram DMA transfers
Other features like register usage highlighting, a stack frame viewer, and a symbols manager have also been started - these are far from finished though. Smile

See /apidoc.htm for javascript api documentation

Edit | Restore | Reply | Report | Link
Eggscellent

Project64 Debugger 1 2 3 4 5 ... 7 »
Users browsing this thread: shygoo

Quick Reply


Inline Post Moderation:  

Moderation Options:


Loading...
  EN ・日本語 
Expand chat